Data-Driven PR Services
Strengthen your brand’s credibility with data-driven PR services that leverage proprietary research and expert storytelling to earn coverage in key media.
Gain credibility and boost visibility with your target audiences
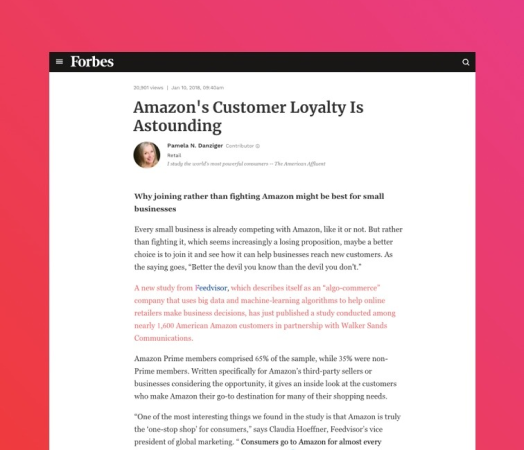
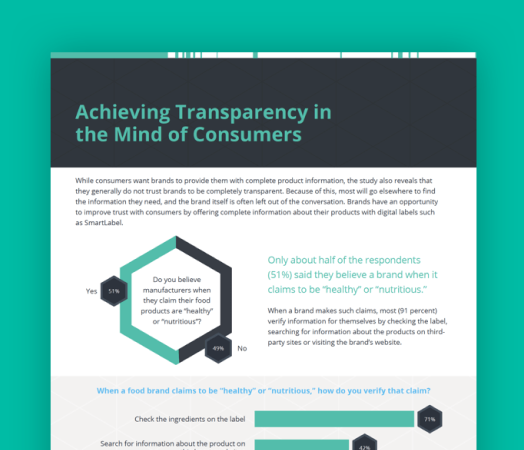
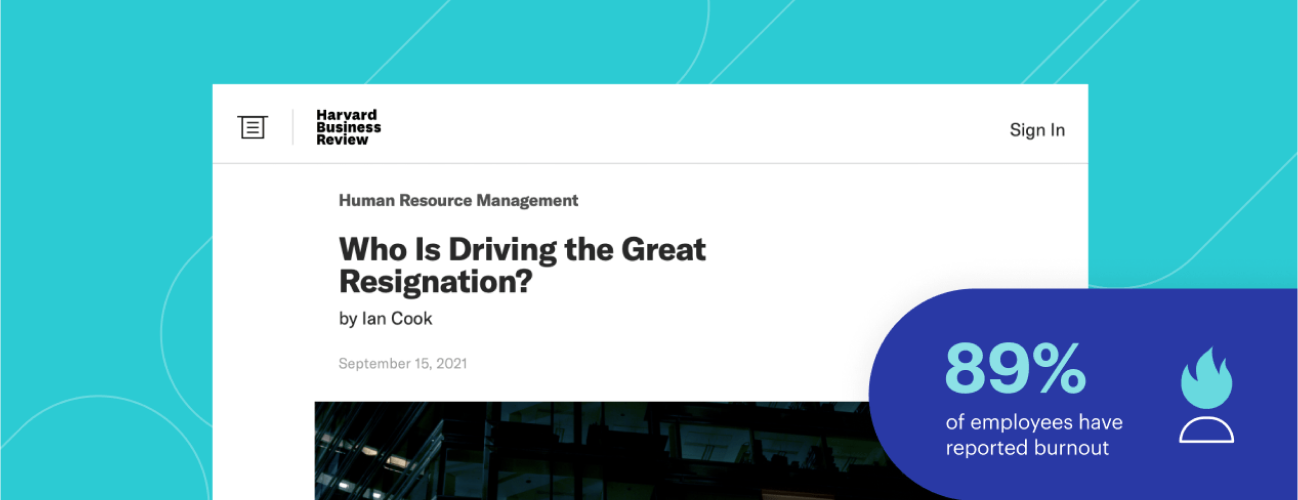
To grab the attention of reporters and audiences, compelling thought leadership insights often aren’t enough. You need data points to back them up — whether that means writing and fielding original research surveys or digging into your own proprietary brand data. But not all data is created equal, and neither are all data-driven PR campaigns. Effective data-driven PR strikes the delicate balance between newsworthy hooks and timeless insights, and between bolstering your value proposition and overt self-promotion. Above all, your data needs to be woven into a compelling narrative that resonates with reporters at target publications.
Walker Sands’ PR experts draw on proven storytelling skills and research expertise to transform raw data into engaging narratives that advance your thought leadership and gain media coverage. We leverage our deep reporter relationships to collaborate directly with journalists, identifying the data points that will resonate with their audiences. Whether you’re just starting out with data or already producing your own research reports, we offer comprehensive support — from amplifying existing product data to guiding you through the end-to-end data report creation process.
Ultimately, Walker Sands’ data-driven PR services can strengthen your reputation, fortify your market position, and elevate your brand’s visibility.
Establish expertise and credibility
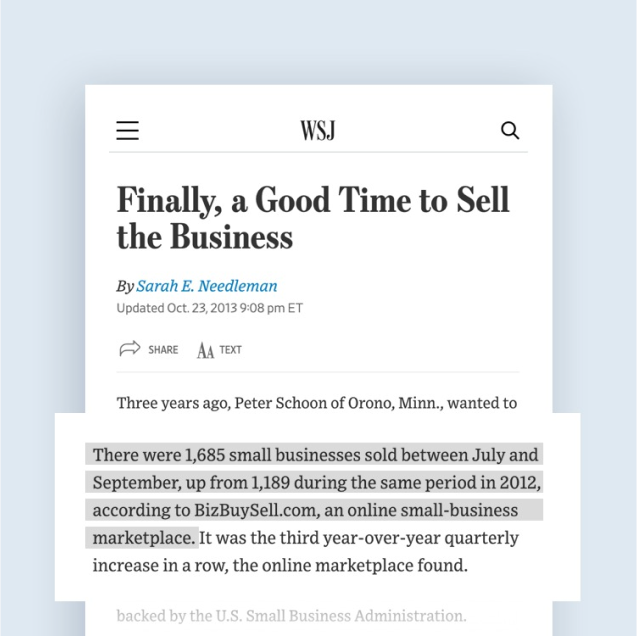
Insert your brand as a trusted source in news stories with high-impact, high-visibility placements that build trust with your target audience, enhancing brand recognition and credibility.
Lock in your market position
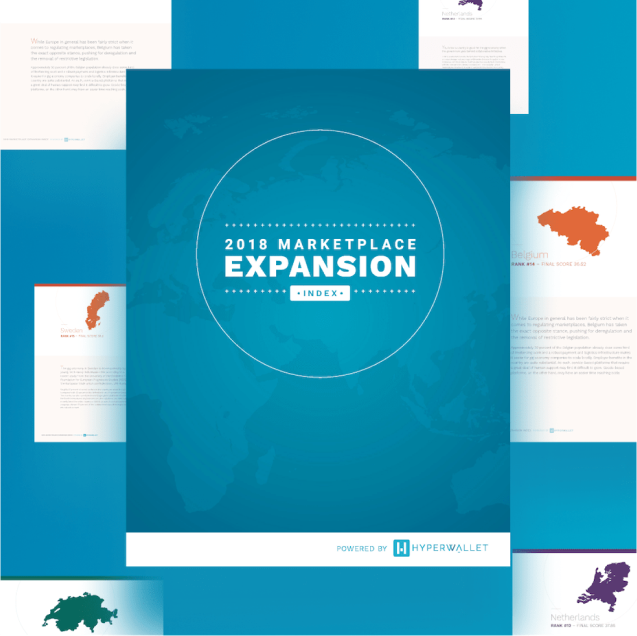
Stake your claim in new markets or pioneer innovative product categories by publishing and publicizing new research on related themes.
Raise brand awareness
Grab readers’ attention with eye-catching original findings and fresh narratives that remain in the news cycle long after data’s originally released.
Data-Driven PR FAQs
What is data-driven PR?
Data-driven PR is a strategic approach to public relations that uses proprietary research, original surveys or existing company data to create compelling narratives for media outreach. It combines storytelling with data insights to capture the interest of reporters and boost credibility.
Will I see immediate coverage if we invest in a data-driven PR campaign?
Most clients see coverage immediately on launch day. Ideally, Walker Sands can share data with journalists before it’s released publicly. Our approach involves creating a comprehensive media outreach plan that includes proactive exclusives and embargoes as well as weekly thought leadership angles. The beauty of high-quality data is that it can continue to generate coverage for weeks, months or even years after its initial release.
What type of data will garner the most coverage?
The goal of data-driven PR isn’t always about quantity, although it certainly can be. To secure a high volume of placements, it’s best to consistently release data and collaborate directly with your target publications to identify their areas of interest. Maintaining a regular flow of data and building relationships with journalists will establish you as a trusted source. When our clients become known for their data work, reporters often proactively reach out to us to fill gaps in their story pipeline or request specific data points when planning their articles.
What if I can’t commission third-party research?
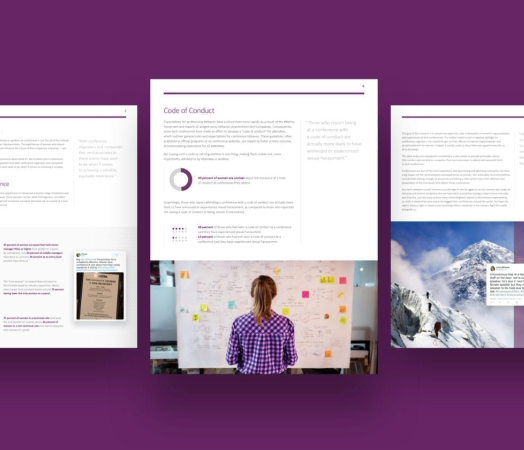
For clients with budget constraints or limited capacity to commission data reports, Walker Sands can help you get creative. Chances are your company already has an untapped reservoir of data you can analyze for interesting insights, including product usage, anonymized customer surveys, and more. We can help you package these findings into press releases, blog posts or designed PDFs.
Explore more outcomes and solutions from Walker Sands
Explore more outcomes and solutions
Discover what data-driven PR can do for your brand.

Executive Vice President + Managing Director, Seattle